Sunday 21 February 2016

Six Sigma Project - Measure Phase

Measure Phase

In Define Phase where I used VSM map to show the current design and manufacture process and a Fish Bone Diagram to highlight the areas within the process which can be improved.

In the measure phase I gathered data from the company’s job management software for a number of recently completed jobs. The operator scans the bar code on the job card which matches to process he/she is carrying out on the job. The software gave me accurate data regarding the hours of each process used on the job.

I was able to retrieve the operation hours for each job through creating a job analysis report using the job management software.


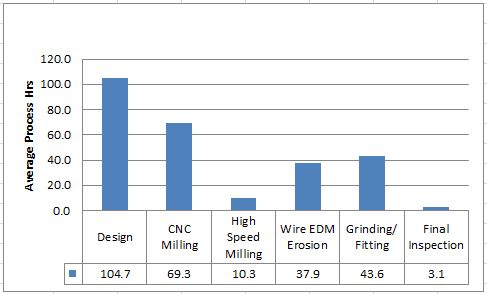
I used a column chart to plot the average hours of each operation over a number of completed jobs. The column chart showed the average hours of the operations used throughout the design and manufacture process.


I also used the job management software to retrieve the data for duration of a number of completed projects, I have plotted these on a line graph which shows the variations in lead times and the average lead-time. 


Friday 5 February 2016

Six Sigma -Define Phase

Define Phase


Introduction
My project is a DMAIC for improvement in the department I work in. We are currently designing and manufacturing high quality solution for our customers. My project will focus on reducing lead-times and production costs. This project could potentially reduce lead times up to 30% and production costs if 30%.

Define
Through direct discussions with our customers we received the feedback that while we are supplying a high quality product the lead-times and prices are not always suitable for their project needs


During the define phase I used a VSM map to illustrate the current design and manufacture process. The VSM map shows the current process from initial customer enquiry through to delivery to customer including supplier lead-times. This allowed me to analyse where in the process the lead-times could be reduced. As the current process is labour intensive a reduction in certain process times would reduce lead-times and production costs.


VSM Chart


I also used a Fish Bone diagram to pinpoint the areas in the process which could be improved to give a reduction in lead-time and production costs. 


This analysis allowed me to identify that the high labour intensive methods throughout the process and limited use of economical standard parts where possible as the main causes of extended lead times and high production costs.