Measure Phase
In Define
Phase where I used VSM map to show the current design and manufacture process
and a Fish Bone Diagram to highlight the areas within the process which can be
improved.
In the
measure phase I gathered data from the company’s job management software for a
number of recently completed jobs. The operator scans the bar code on the job
card which matches to process he/she is carrying out on the job. The software
gave me accurate data regarding the hours of each process used on the job.
I was able to retrieve the operation hours for each job through creating a job analysis report using the job management software.
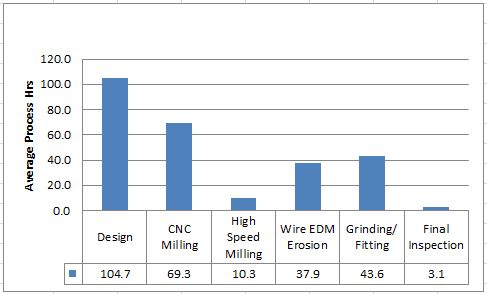
I used a column chart to plot the average hours of each operation over a number of completed jobs. The column chart showed the average hours of the operations used throughout the design and manufacture process.
I also used the job management software to retrieve the data for duration of a number of completed projects, I have plotted these on a line graph which shows the variations in lead times and the average lead-time.


No comments:
Post a Comment