Sunday, 17 April 2016

Control Phase

Control Phase

As part of the control phase an operational procedure was put in place to aid the design team in designing components which suit the EDM wire erosion process where possible. Part of the procedure was an additional design review with the production manager in-order to appraise the designs suitability for the EDM wire erosion process and to plan future process capacity for the wire EDM department. These design reviews will also be used as a method of evaluating the design teams ability to apply new design methods.


We put a control plan in place to show the strategy that would be used to control the improved process.


The average process hours and design and manufacture lead-time are measured using the Job management software. These metrics are taken after the completion of each job and analysed using a control chart in-order to ensure that the reductions in average process hours and design and manufacture lead-times achieved in the Improve phase is maintained in future projects.

Sunday, 3 April 2016

Improve Phase

Improve Phase

During the analysis phase it was highlighted the negative effect the CNC milling had on the manufacturing process. EDM wire erosion was highlighted as a process which could potentially replace a lot of the CNC milling process hours having a positive effect on the total process hours. While being a less labour intensive process the EDM wire erosion process also reduces the requirement for finishing processes such as grinding/fitting and high speed milling. Therefore an increase in usage of the wire erosion process will reduce these process hours.

As part of the Improve Phase the Design process was changed to ensure components were designed in a manner which allowed as much of the machining to be carried out using the wire erosion process where possible and practical.

It was also decided to put an extra shift in place in the EDM wire erosion division in-order to provide the capacity required to cope with the extra process hours being directed through the division. The addition of the extra shift would have a positive effect on the project lead times therefore allowing the metrology division to offer customers reduced lead times to meet there project requirements.


It was decided to plan work going through the EDM division in such a way to allow jobs with high run times to be set up during the second shift therefore allowing them to run unmanned through the night.

Sunday, 13 March 2016

Analysis Phase

Analyse Phase

During the Analyse phase we looked at the data gathered of the operation hours and lead-times over a series of completed jobs. We analysed this data in-order to determine the root cause of the high production costs and long lead-times.


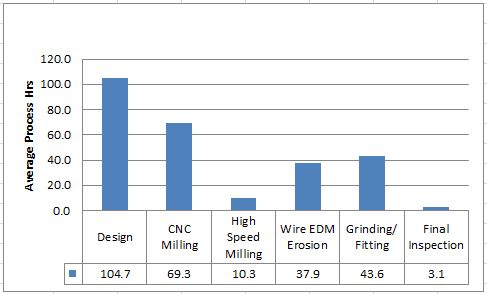
During a brainstorming session we analysed the average process hours for each operation in the manufacturing process. We used a cause and effect diagram to pin-point which process steps have biggest negative and positive influences on the production cost and lead-times. 


The analysis highlighted the negative effect CNC milling had on the manufacturing process. The CNC Milling operation is both labour intensive and leads to the requirement of other operations later in the manufacturing process. Wire EDM erosion on the other hand is not labour intensive and produces finished components which reduces the requirement of other operations later in the process. Another advantage of the Wire EDM process highlighted was an ability to run lights out which would have a positive effect on both production costs and lead-times. It was also evident that the design operation had major influence on how each job passed through the manufacturing process.


The analysis highlighted that a reduction in the CNC Milling operation by increasing the use of the Wire EDM Erosion operation would have a positive effect on both production costs and lead-times.

Sunday, 21 February 2016

Six Sigma Project - Measure Phase

Measure Phase

In Define Phase where I used VSM map to show the current design and manufacture process and a Fish Bone Diagram to highlight the areas within the process which can be improved.

In the measure phase I gathered data from the company’s job management software for a number of recently completed jobs. The operator scans the bar code on the job card which matches to process he/she is carrying out on the job. The software gave me accurate data regarding the hours of each process used on the job.

I was able to retrieve the operation hours for each job through creating a job analysis report using the job management software.


I used a column chart to plot the average hours of each operation over a number of completed jobs. The column chart showed the average hours of the operations used throughout the design and manufacture process.


I also used the job management software to retrieve the data for duration of a number of completed projects, I have plotted these on a line graph which shows the variations in lead times and the average lead-time. 


Friday, 5 February 2016

Six Sigma -Define Phase

Define Phase


Introduction
My project is a DMAIC for improvement in the department I work in. We are currently designing and manufacturing high quality solution for our customers. My project will focus on reducing lead-times and production costs. This project could potentially reduce lead times up to 30% and production costs if 30%.

Define
Through direct discussions with our customers we received the feedback that while we are supplying a high quality product the lead-times and prices are not always suitable for their project needs


During the define phase I used a VSM map to illustrate the current design and manufacture process. The VSM map shows the current process from initial customer enquiry through to delivery to customer including supplier lead-times. This allowed me to analyse where in the process the lead-times could be reduced. As the current process is labour intensive a reduction in certain process times would reduce lead-times and production costs.


VSM Chart


I also used a Fish Bone diagram to pinpoint the areas in the process which could be improved to give a reduction in lead-time and production costs. 


This analysis allowed me to identify that the high labour intensive methods throughout the process and limited use of economical standard parts where possible as the main causes of extended lead times and high production costs.